Diversity is a defining feature of Africa, adding a rich tapestry of cultures, languages, and traditions that make the continent uniquely vibrant. Despite its complexities, ethnic diversity stands as one of Africa’s greatest strengths, shaping the region’s identity and contributing to its dynamic cultural environment. Each ethnic group adds to the continent’s vitality through varied modes of expression, fostering creativity, innovation, and problem-solving.
As the world becomes increasingly interconnected, recognizing and celebrating ethnic diversity is essential. Diversity is not just about having a variety of cultures but about understanding and appreciating the unique perspectives and experiences that each culture brings to the table. Ethnic diversity promotes creativity, fosters innovation, and aids in problem-solving. Different cultural perspectives often lead to new and innovative solutions, creating a richer and more vibrant environment.
By embracing different cultures and backgrounds, organizations can gain a better understanding of their customers and markets, allowing them to create new products and services that better meet the needs of a diverse population. This can help keep companies competitive in an ever-changing marketplace. By considering different perspectives and experiences, teams can come up with better solutions to complex problems.
Also, read; From Refugee to Northern Ireland’s First Black Mayor: Meet Lilian Seenoi-Barr
Interestingly, some countries are more ethnically diverse than others. Based on statistics from World Population Review, a data platform that tracks population growth periodically, the majority of the most diverse countries in the world are African. Below are 10 of the most ethnically diverse countries in Africa by ethnic fractionalization. Fractionalization is a measure of the likelihood that two randomly selected people in a given country will be from two different groups (ethnicities, religions, etc.) or speak two different languages.
1. Uganda
Fractionalization: .9302
Probability of diversity: 93.02%
Uganda tops the list with an ethnic fractionalization score of .9302, indicating a 93.02% probability that two randomly selected individuals will be from different ethnic groups. This high level of diversity is reflected in Uganda’s cultural landscape, which includes a wide range of languages, traditions, and cultural practices. The presence of numerous ethnic groups such as the Baganda, Banyankole, Basoga, and many others enriches the nation’s cultural fabric.
2. Liberia
Fractionalization: .9084
Probability of diversity: 90.84%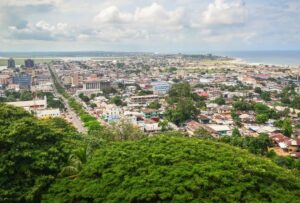
Liberia’s ethnic fractionalization score of .9084 highlights its significant diversity, with a 90.84% probability that two randomly selected individuals will be from different ethnic groups. This diversity is mirrored in Liberia’s array of ethnic communities, including the Kpelle, Bassa, and Grebo, among others. The country’s complex history and migration patterns have contributed to its rich cultural mosaic.
3. Madagascar
Fractionalization: .8791
Probability of diversity: 87.91%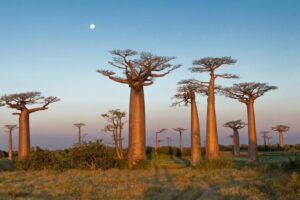
Madagascar, with a fractionalization score of .8791, showcases a probability of 87.91% that two randomly selected individuals will belong to different ethnic groups. The island nation’s unique blend of African and Asian influences is evident in its diverse ethnic groups, such as the Merina, Betsimisaraka, and Sakalava. This diversity contributes to Madagascar’s rich cultural heritage and traditions.
4. Democratic Republic of Congo
Fractionalization: .8747
Probability of diversity: 87.47%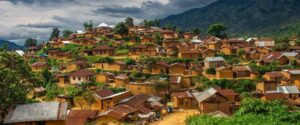
The Democratic Republic of Congo (DRC) has a fractionalization score of .8747, indicating an 87.47% probability of ethnic diversity. The DRC is home to numerous ethnic groups, including the Luba, Kongo, and Mongo, each with distinct languages and cultural practices. This diversity is a testament to the country’s vast and varied cultural landscape.
5. Republic of Congo
Fractionalization: .8747
Probability of diversity: 87.47%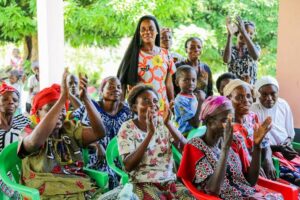
The Republic of Congo shares the same fractionalization score as its larger neighbor, the DRC, at .8747. This score reflects an 87.47% probability of ethnic diversity. The country’s ethnic composition includes groups such as the Kongo, Sangha, and M’Boshi, each contributing to the rich cultural tapestry of the nation.
Also, read; Top 10 African Countries with the Largest Gold Reserves
6. Cameroon
Fractionalization: .8635
Probability of diversity: 86.35%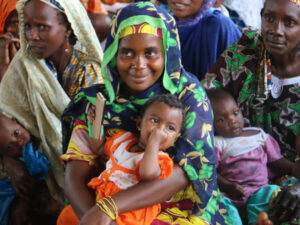
Cameroon’s fractionalization score of .8635 demonstrates an 86.35% probability that two randomly selected individuals will be from different ethnic groups. The country is known for its extensive ethnic diversity, with over 250 ethnic groups, including the Bamileke, Fulani, and Bassa. This diversity is a cornerstone of Cameroon’s cultural identity and societal structure.
7. Chad
Fractionalization: .8620
Probability of diversity: 86.20%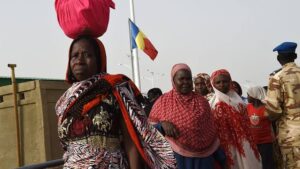
Chad, with a fractionalization score of .8620, reflects an 86.20% probability of ethnic diversity. The country’s diverse ethnic landscape includes groups such as the Sara, Kanembu, and Arab, each with unique cultural practices and traditions. This diversity plays a crucial role in shaping Chad’s cultural and social dynamics.
8. Kenya
Fractionalization: .8588
Probability of diversity: 85.88%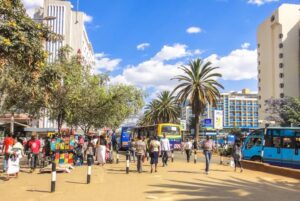
Kenya’s ethnic fractionalization score of .8588 indicates an 85.88% probability of diversity. The country’s rich ethnic composition includes groups such as the Kikuyu, Luo, and Luhya, each contributing to Kenya’s vibrant cultural scene. This diversity is a significant factor in Kenya’s social and cultural development.
9. Nigeria
Fractionalization: .8505
Probability of diversity: 85.05%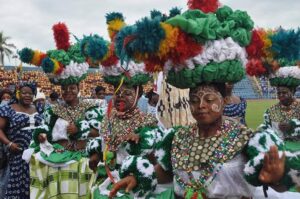
Nigeria, with a fractionalization score of .8505, shows an 85.05% probability of ethnic diversity. As Africa’s most populous country, Nigeria is home to a vast array of ethnic groups, including the Hausa, Yoruba, and Igbo. This diversity is central to Nigeria’s national identity and cultural richness.
10. Central African Republic
Fractionalization: .8295
Probability of diversity: 82.95%
The Central African Republic (CAR) has a fractionalization score of .8295, indicating an 82.95% probability of ethnic diversity. The country’s ethnic landscape includes groups such as the Baya, Banda, and Mandjia, each playing a role in the CAR’s cultural diversity.
Conclusion
Africa showcase the continent’s unique blend of cultures, languages, and traditions. This diversity, while sometimes leading to challenges, ultimately enriches each nation’s social fabric, fostering creativity, innovation, and problem-solving capabilities. Embracing and celebrating this diversity not only enhances cultural understanding and appreciation but also drives economic and social development.
As Africa continues to grow and evolve, its ethnic diversity will remain a key asset, shaping its identity and contributing to a vibrant and dynamic future. Recognizing and valuing the myriad of perspectives and experiences that come from such diversity will be crucial for the continent’s progress and unity.
